


How to Make and Use a Fishbone Diagram Template
Fishbone diagrams are a very helpful tool in your problem-solving arsenal. It is used to figure out cause-and-effect and to breakdown the contributing factors of an issue. They are named for their shape which, when completed looks like a fish’s bones. A fishbone diagram can also be referred to as a cause-and-effect diagram, Herringbone diagram, an Ishikawa diagram (after the man who invented it). Before you can create a fish-bone diagram you must have an in-depth understanding of the process or the problem. It is important that those closest to the issue complete the diagram or be involved in the brainstorming session to make it. If you are completing a DMAIC project you would use a fishbone diagram in the Analyse phase.
A Fishbone diagram can also be used to analyse a new design, understand a current process and highlight opportunities to optimise the existing process. In this capacity, the advantage of the fishbone diagram is gaining a greater understanding of how elements of the process result in the outcome. Using this structure removes the clutter and may allow you to see things you missed before.
WHY IS A FISHBONE DIAGRAM A GREAT PROBLEM-SOLVING TOOL?
A recurring theme in a lean or six-sigma transformation is removing the clutter to allow you to see waste or opportunities for improvement. A fishbone diagram aims to break down and organise the Causes of an issue to reveal what elements have the greatest impact. Grouping the “causes” means you can think about the different elements of the problem as separate from the overall process. One or two of these “causes” will have a greater effect than the others and will guide you to the root of the problem. This structure also allows you to tackle smaller chunks which have a large impact on the problem. Looking at elements of the problem and not the whole process will likely make finding your solution less daunting and problem solving more manageable.
HOW TO CREATE A FISHBONE DIAGRAM
I suggest that for your first few attempts use a pencil, a ruler and a rubber to make your diagram. This allows you to quickly make changes and gives flexibility when you or your brainstorming team has a new thought about your diagram. Once you’ve finished or have gotten the hang of it you can transfer to your computer. A white board is also very useful in a large brainstorming session, you can take a picture after and transfer the diagram to PowerPoint or just save the picture.
To make a fishbone diagram follow the steps listed below.
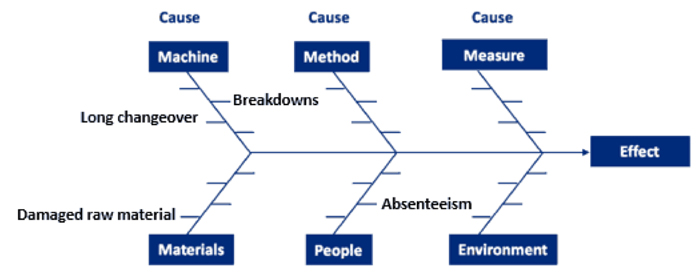
An example of these aspects could be under machine the start-up time may be a factor. Under people absenteeism could be causing your undesired effect. However, always keep your specific effect in mind, if absenteeism doesn’t factor in your problem, don’t list it.
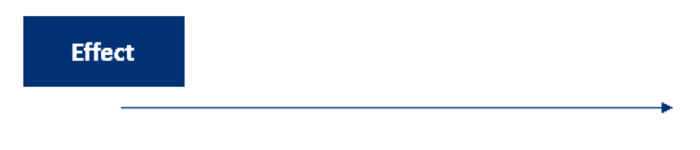
Step 1- Place the problem or the “Effect” on the right side of the page. Draw an arrow to the left pointing at the effect.
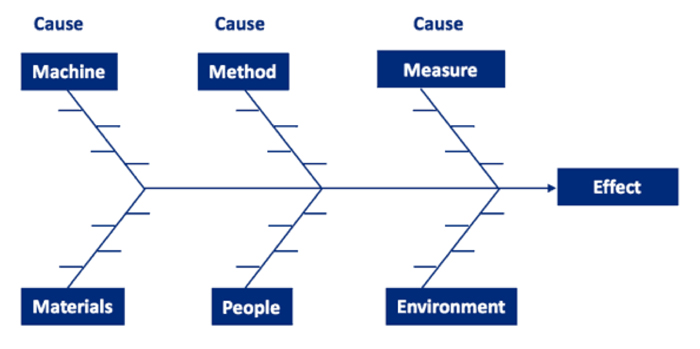
Step 2– Put the inputs to the process at a distance above and below the arrow. (You can put anything in the input boxes but the six listed below are a good guideline.) Connect the inputs with lines to the arrow.
Step 3- Add the causes relevant to each input on the horizontal lines. We have added some examples below.
Below is an example fishbone diagram for a package delivery company, struggling with late deliveries.
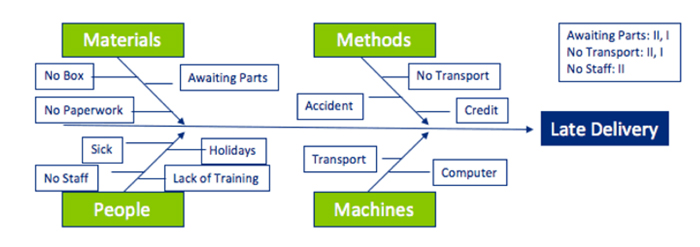
The Next step in the fishbone problem solving tools is to prioritise or screen the causes to determine which are having the largest effect. One identified focus on these. An easy Cause screening method involves looking at each one and asking two questions
- How likely is this cause to be the major source of the issue or variation?
V- Very Likely
S- Somewhat Likely
N- Not Likely - How easy would it be to fix or control?
V- Very Easy
S- Somewhat Easy
N- Not Easy
Put the answers of the two questions together. Work on the Cause which have a result of VV, VS and SV.